Regression trees using Python
In data mining, machine learning and / or data science, in what refers to the analysis with trees, there are two main approaches: the decision trees Y the regression trees.
In both cases the trees constitute predictive methods of segmentation, known as classification trees. They are sequential partitions of the data set made to maximize the differences of the dependent variable given that a division of the cases into groups is carried out.
Through different indices and statistical procedures the most discriminating division among the selected criteria is determined, the one that allows the different groups to be better differentiated from the base criterion, thus obtaining a first segmentation. From that first segmentation, new segmentations are made of each of the resulting segments and so on until the process ends with some statistical rule.
Suppose now that we want to know which passengers of the Titanic were more likely to survive its sinking and what characteristics were associated with the survival of the shipwreck. In this case, the variable of interest (GS) is the degree of survival.
We could then divide the passengers into groups by age, sex, class in which they traveled and observe the proportion of survivors of each group.
A procedure based on trees, automatically selects the homogeneous groups with the greatest difference in the proportion of survivors among them. In the first case, sex (men and women).
The next step consists in subdividing each group of men and women according to other characteristics. As a result, men are divided into adults and children, while women are divided into groups based on the class in which they traveled.
When the subdivision process is completed, the result is a set of rules that can be easily visualized by a tree.
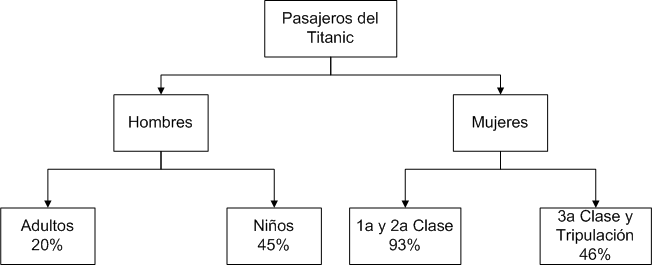
With the representation of the previous figure we can observe, for example, that if a passenger is male and is an adult, then he has a 20% chance of survival.
The proportion of survival in each of the subdivisions can be used for purposes predictive to predict the degree of survival of the members of that group.
Using different predictors (independent variables) at each level of the division process represents a simple and elegant way to handle iterations.
The procedure creates a classification model based on trees, and classifies cases into groups or forecasts values of a dependent variable based on the values of the independent variables.
- Segmentation. Identify individuals who can be members of a specific group.
- Stratification. Assign the cases to a category among several, for example groups of high risk, low risk or intermediate risk.
- Prediction. Create rules and use them to predict future events, such as likelihood of a person causing default on a credit, or the resale value of a vehicle or property
A tree-based data analysis It allows identifying homogeneous groups with high or low risk and facilitates the construction of rules to make forecasts about individual cases.
For trees both dependent and independent variables can be nominal, ordinal and scale.
- They are nominal when their values present categories that do not obey an intrinsic order. For example, the area where an employee works
- They are ordinal when their values present categories with some intrinsic order. For example, the levels of satisfaction of a service.
- They are of scale when their values represent categories ordered with a metric with meaning, because here the comparisons of distance between values are adequate. For example, age in years, income in currency, etc.
Types of trees
The three types of trees most used today are: CHAID trees, CART trees and QUEST trees
- CHAID trees (Chi-square Automatic Interaction Detector). It is the conclusion of a series of methods based on the automatic interaction detector (AID) of Morgan and Sonquist. It is a useful exploratory method to identify important variables and their interactions focused on segmentation and descriptive analysis.
- CART trees (Classification and Regression Tree). It is an alternative to the exhaustive CHAID for classification trees with categorical dependent variables. For what is used for classification with qualitative dependent variables and for regression with quantitative dependent variable, generating binary trees.
- QUEST trees (Quick, Unbiased, Efficient, Statistica Tree). It consists of an arborescent classification algorithm specially created to solve two of the main problems presented by the comprehensive CART and CHAID methods when dividing a group of subjects according to an independent variable.
In this article we will focus on the CART trees for regression and in the next one we will do it for classification.
Algorithm for Regression CART Trees
Suppose we have a data set with two dependent variables X1 and X2 and Y being the dependent variable to predict.
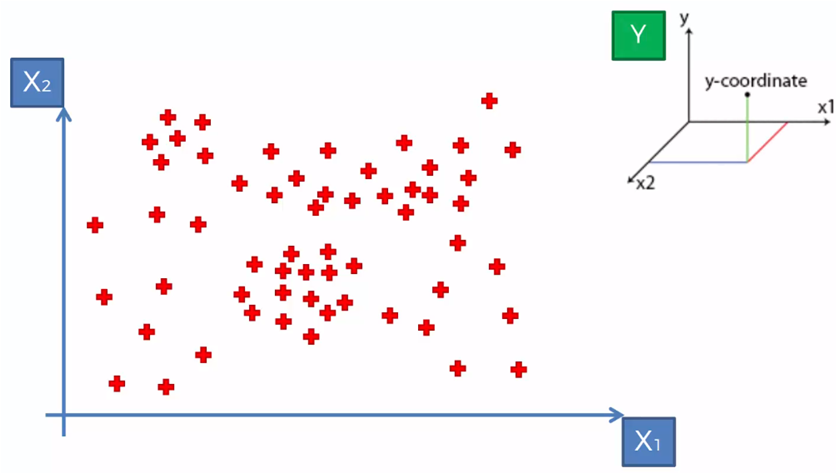
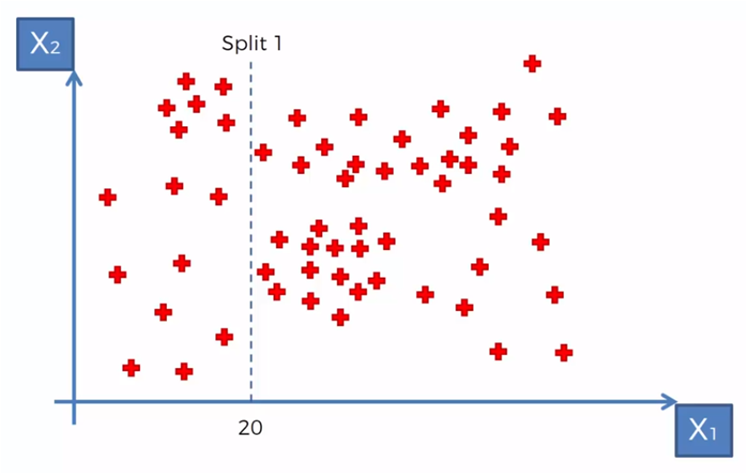
According to some established criteria we could begin to segment the data in relation to certain values for X1 and X2. For example, if we need to create groups with data where X1 is less than 20, we would have a group for X1 <20 and a group for X1> = 20, so for the algorithm we created a division in X1 = 20
Then, for the data where X1> 20 we need to create a group of values with X2> 170 and X2 <= 170, so we mark another division as in the following graph.
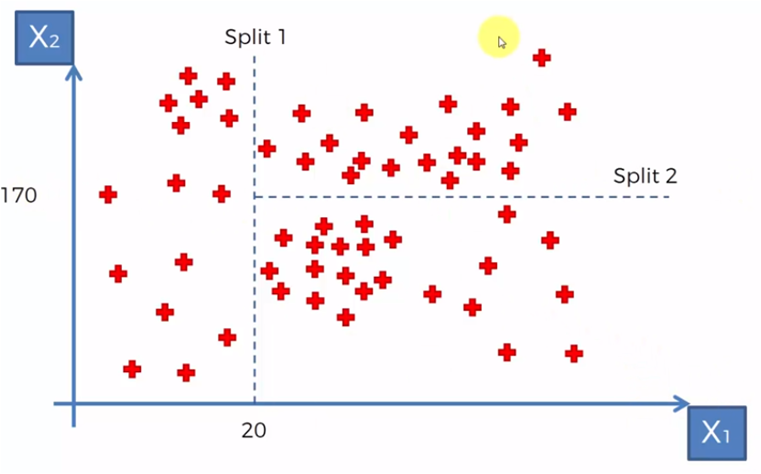
and after that, we create two more divisions, one for the data where X1 <20, we divide into two groups, those with values for X2 smaller and greater than 200. Division 4 for the data where X2> 20 and X1 <170 , we require those that are greater than 40 in X1
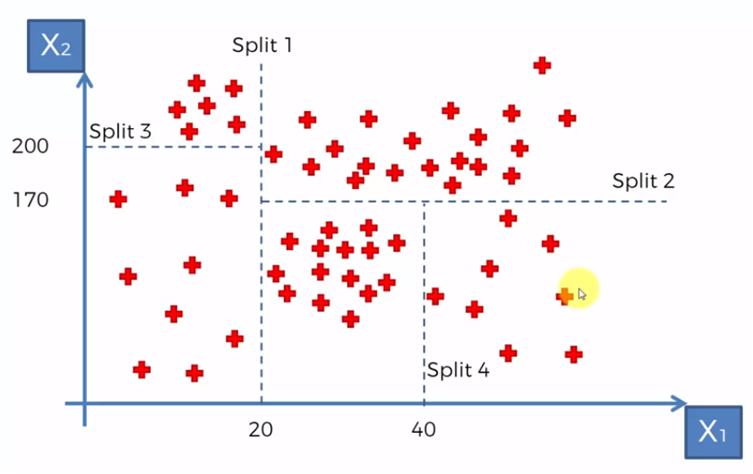
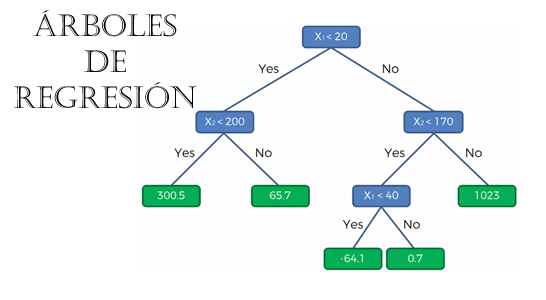
As the segments are created, a binary, tree-like structure is formed in the following way, where we represent the groups based on the division lines shown in the previous graphs.
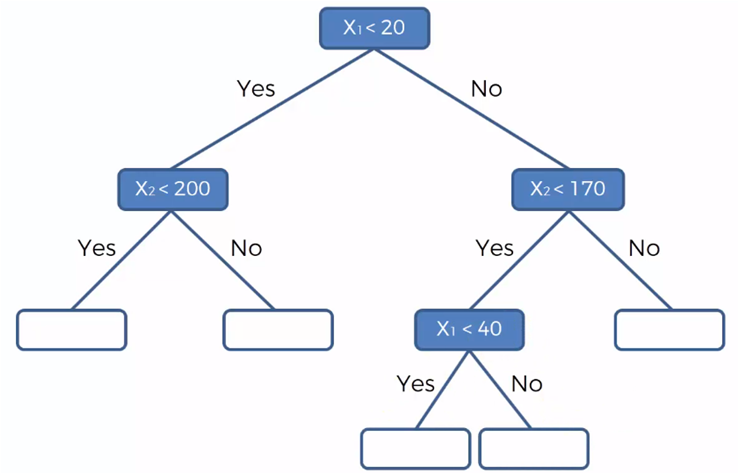
The blue nodes represent the four divisions that were made in the graphs of the data sets and the white nodes, the data belonging to each group. If in each of these groups the value of the dependent variable is the same within the same group and different between groups. We can now predict the value of Y (dependent variable) for unknown or additional data with values for X1 and X2 that fall into a specific group.
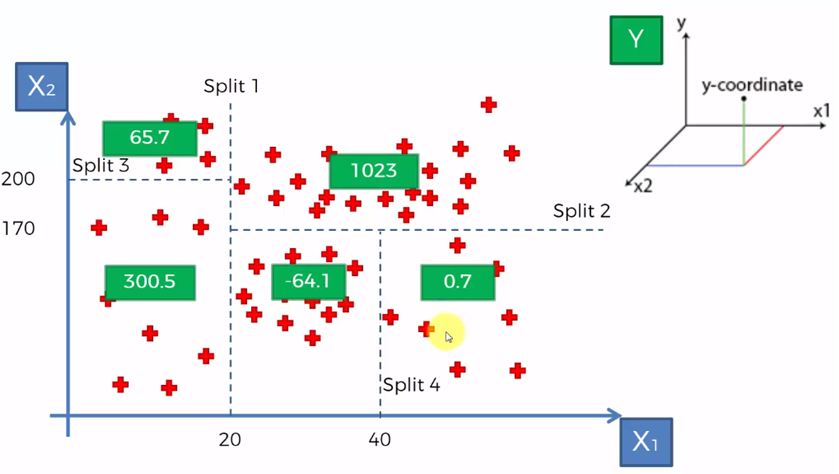
The green boxes represent the value of Y (the dependent variable) and now represented in the graph of the tree, we give it in the following way:
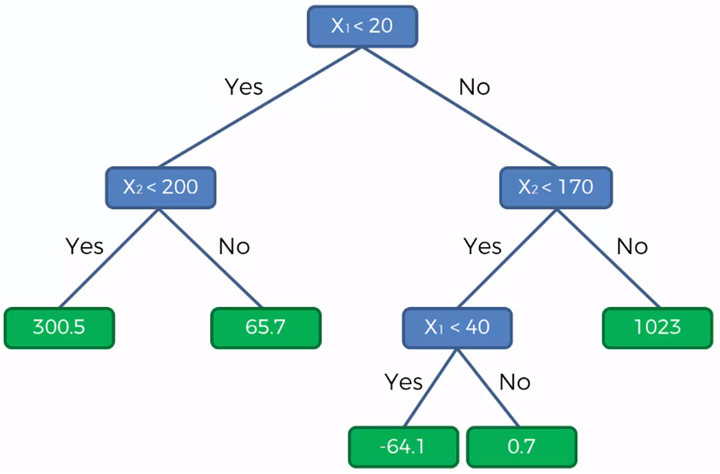
With this diagram we can determine that, for example, the value of Y for a point given by (28, 115) where X1 = 28 and X2 = 115, then Y will be equal to -64.10
Regression trees with Python
For the example with python, suppose we have the following set of data that represents the salary of an employee according to the level and position in which he is in the organization
| Position | level | Salary |
| Business Analyst | 1 | 45,000 |
| Junior Consultant | 2 | 50,000 |
| Senior Consultant | 3 | 60,000 |
| Manager | 4 | 80,000 |
| Country Manager | 5 | 110,000 |
| Region Manager | 6 | 150,000 |
| Partner | 7 | 200,000 |
| Senior Partner | 8 | 300,000 |
| C-level | 9 | 500,000 |
| CEO | 10 | 1,000,000 |
We load the libraries and the data file that contains the previous table, where we will use the level as the independent variable and the salary as the dependent variable.
# Regression trees import numpy as np import matplotlib.pyplot as plt import pandas as pd dataset = pd.read_csv ('Salary_per_Position.csv') X = dataset.iloc [:, 1: 2] .values y = dataset.iloc [ :, 2] .values
Once we have executed the previous code fragment, we obtain the dataset and the variables X and Y
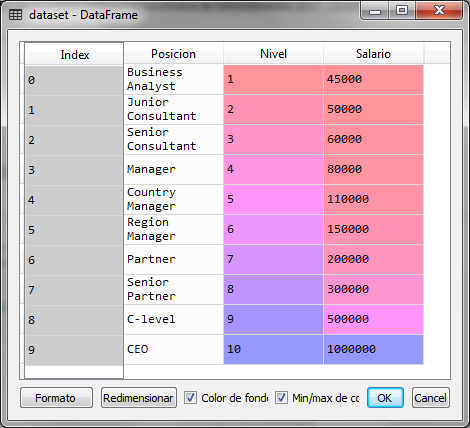
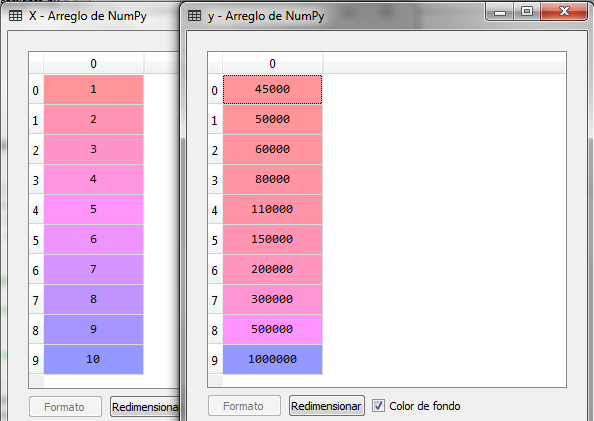
The next step is to import the DecisionTreeRegressor class from the tree package of the sklearn library to create a regressor object and adjust the X and Y data and then make the prediction with a Level 6.5 value, that is, a position in the organization that has the level 6.5
#Regional Linear Simple import numpy as np import matplotlib.pyplot as plt import pandas as pd dataset = pd.read_csv ('Salary_per_Position.csv') X = dataset.iloc [:, 1: 2] .values y = dataset.iloc [ :, 2] .values # Setting the decision tree to the dataset from sklearn.tree import DecisionTreeRegressor regressor = DecisionTreeRegressor (random_state = 0) regressor.fit (X, y) # Salary prediction for level 6.5 y_pred = regressor.predict ( 6.5)
After executing the last fragments of the code, y_pred which is the variable where it saves the result of predicting which group the value of 6.5 belongs to for the salary level we have the following:
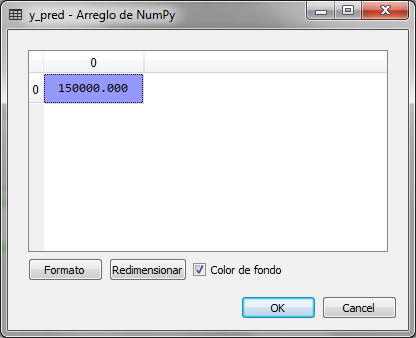
We observe that the result is 150,000, which corresponds to the salary of level 6, that is, the node of level 6 corresponds to values of X from 5.6 to 6.5, to observe it that way we create the following graph:
# Visualization of decision tree results X_grid = np.arange (min (X), max (X), 0.01) X_grid = X_grid.reshape ((len (X_grid), 1)) plt.scatter (X, y, color = 'network') plt.plot (X_grid, regressor.predict (X_grid), color = 'blue') plt.title ('Decision Tree Regression') plt.xlabel ('Position Level') plt.ylabel ('Salary ') plt.show ()
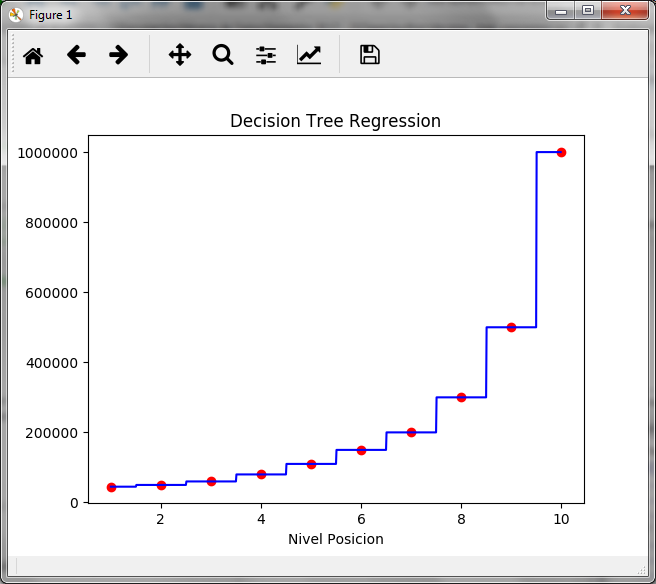
As seen in the stepped graph, the value of 150,000 for the salary is maintained from level 5.6 to level 6.5. A level 6.6 would already give us a salary of 200,000 corresponding to level 7.
Regression trees allow you to predict a value for the dependent variable that belongs to a group created by the tree.
Resources and additional comments
Run the models of machine learning in the cloud it can be an advantage depending on the amount of data we have given that we could require more processing power for model training.
In this sense, knowing the advantages of cloud services becomes an important need, so in the following link you could learn, in a very economical way, AWS (Amazon Web Service) with the certification of either associated or professional: AWS Professional Certification
If, on the other hand, you are interested in Azure, here you can see for free a webinar that presents all the advantages and how to start with Azure
Buenos información, gracias por compartir conocimiento.
Por favor será posible compartir la ppt y la data de todos los temas tratados.
Gracias
Buenos información, gracias por compartir conocimiento.
Por favor será posible compartir la ppt y la data de todos los temas tratados.
Gracias
Hola, Gracias
Te paso el link para descargarlo
https://drive.google.com/drive/folders/1Jdg2ttdM8pvSdC2ndd5tS5rPI37uTC_t?usp=sharing
Gracias, te paso el link para descargarlos
https://drive.google.com/drive/folders/1Jdg2ttdM8pvSdC2ndd5tS5rPI37uTC_t?usp=sharing